Practical - 9
Practical 9
Aim: Execute queries in the Neo4j graph database and in Gephi tool perform the operations of loading csv data, running graph statistics scripts and displaying various graphical layouts.
Theory:
What is graph data?
Graph data science is linked to data science, where connexions are first-class people, and a stronger, more detailed forecast can be made using the ties between the data points.
How graph data is stored? and how it is represented?
Graph data is contained in storage files, each of which includes data, such as nodes, associations, labels, and properties, for a certain part of the graph. A data graph is a graphic display of knowledge from which we can more readily interpret similarities and patterns quickly.
How to visualize graph data and devise conclusions/results?
By looking at the graph correctly, we can imagine graph data and we can get the successful knowledge that shows mechanisms that might be present in the graphs and assist the user to understand that.
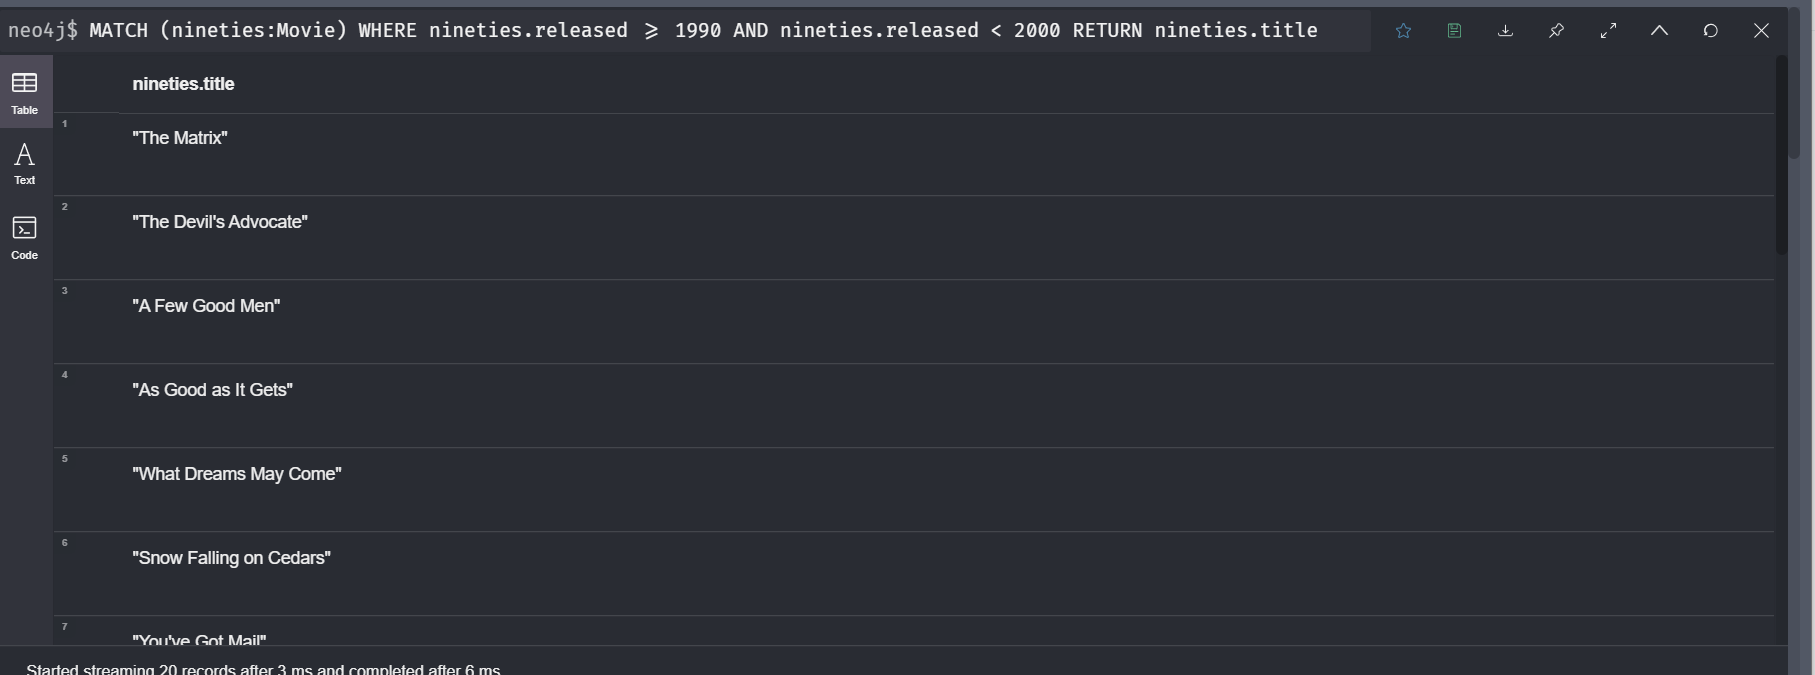
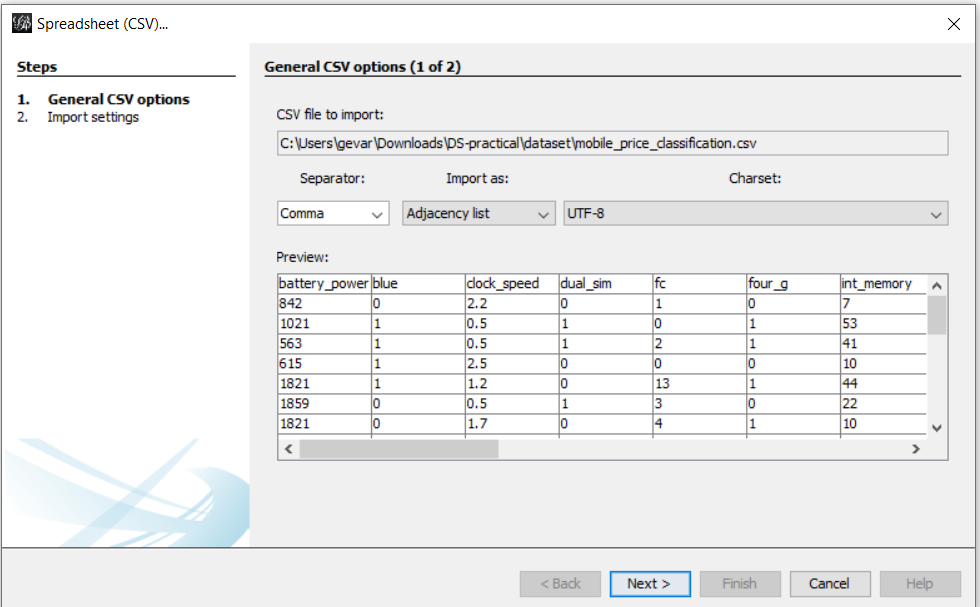
Output:
1.Neo4j


Comments
Post a Comment