Practical - 6
Practical 6
Aim: Introduction to PowerBI and Get started with PowerBI, Prepare data for analysis and Model data in Power BI.
Theory:
What is Power BI?
Power BI is a business analytics service by Microsoft. It aims to provide interactive visualizations and business intelligence capabilities with an interface simple enough for end users to create their own reports and dashboards.
Which different types of visualization it provides?
Here are the visualizations types in Power BI:
1. Area Charts
2. Line Charts
3. Bar Charts
4. Column Charts
5. Combo Charts
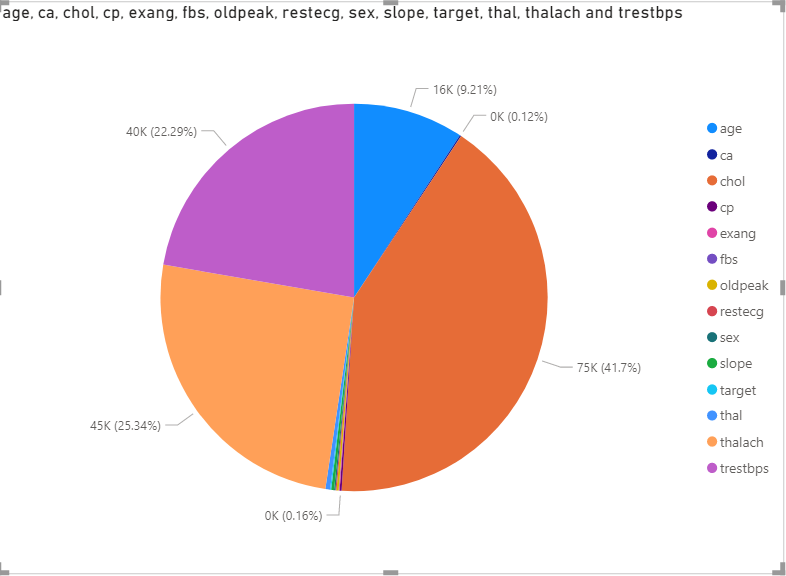
6. Pie Charts, and many more.
Does this visualization is dynamic?
Yes, When you create multiple visualizations that are connected to the same data source or multiple data sources with the linked data columns, Power BI creates a relationship between visualizations which make dashboards dynamic.
Can it take data directly from API and update in real time?
Yes, Power BI with real-time streaming lets you stream data and update dashboards in real time. Any visual or dashboard created in Power BI can display and update real-time data and visuals.
How to do data-preprocessing in Power BI?
Power BI has integrated with Python, the language used for Data Science workloads since August 2018 release. Similar to other methods like GUI or R scripts, now you can use Python to do data manipulation in your Power BI model.
Dataset Description :
- age
- sex
- chest pain type (4 values)
- resting blood pressure
- serum cholestoral in mg/dl
- fasting blood sugar > 120 mg/dl
- resting electrocardiographic results (values 0,1,2)
- maximum heart rate achieved
- exercise induced angina
1. take data from the computer


2. Visualize the data

Comments
Post a Comment